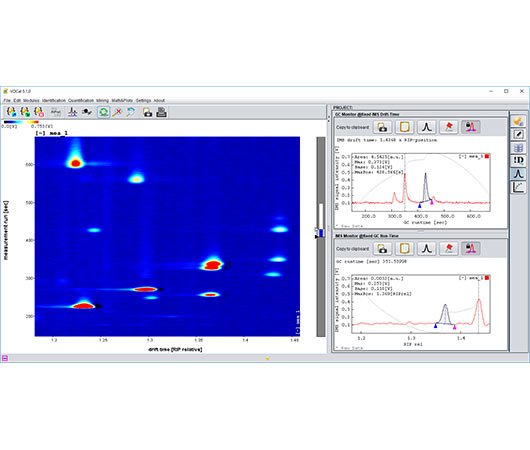
Software for Microsoft® Windows® operating systems
Visualisation and organisation of GC-IMS measurements in *.MEA format
- Method development by simple evaluation area drawing / adjusting
- Generation of substance definition calibration files (GSD) that allow automated quantitation on devices (supported devices: GC-IMS, FlavourSpec®, BreathSpec®)
- GC process normalization to support compound identification via retention index libraries (NIST2014 RI library included)
- Operator upgradeable retention index and IMS drift time libraries for identification
- Compound pattern similarity analysis (fingerprint) based on Euclidian distances
- Optional embedded interface to principal component- and data mining analysis tool
- Extensive export possibilities to all visualization- and data (e.g. CSV-Format)
- Available languages: english, german, chinese
Plug-ins
In to the aforementioned functionalities further useful data analysis tools support analysts to compare entire chromatograms with respect to 1, 2- or even 3-dimensional data representations and are powerful tools for determining and evaluating signal patterns. Beyond that they facilitate identifying specific marker compounds or different amount of the same present substances within different samples and enable a comprehensible graphical representation of the result.
The ‘ Reporter’ plug-in is a very useful tool for re/-presentation, combination and analysis of GC-IMS data to quickly visualize entire chromatograms, compare them with or even substract them from each other to visualize differences of volatile composition of a sample within a second. The ‘ Gallery Plot’ cuts out selected compound peaks within chromatograms and allows to compare their intensities in bigger datasets in order to visualize similarities or differences in the fingerprint of samples, show in- or compound decrease over time or rather variations in intensities.